In 2017, I started reading again for the first time in about three years, and I felt lost because I had missed the hype of different books and book-related services.
Growing up I was an avid reader, but my reading became sporadic as I grew older because I was often scolded for reading at inappropriate times. I remember being criticized by a teacher for reading a copy of “Holes” by Louis Sacher in class because I thought Stanley Yelnats’ story was more important than her lesson.
Feeling overwhelmed by all the new book-related content I had missed, I made a Goodreads profile. At the time, it was a helpful website because it allowed me to keep track of how many books I could remember reading over twenty-five years and the books I wanted to read in a year.
Yet, despite these helpful attributes, I still felt dissatisfied because Goodreads had limited what readers could do.
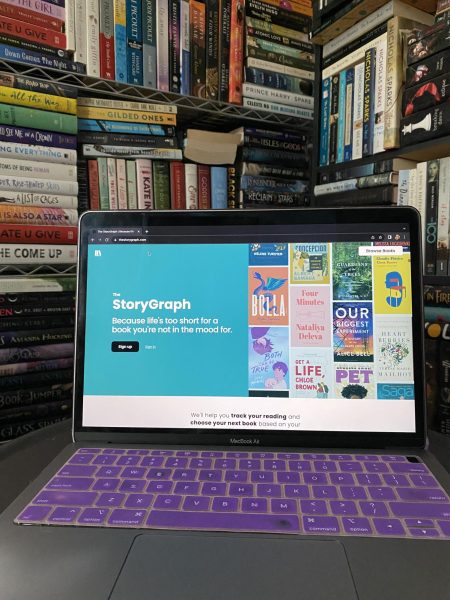
That’s when I discovered The StoryGraph. At first, I was a little apprehensive because I assumed it would be an exact copy of its competitor, Goodreads. However, The StoryGraph surprised me with features I had never thought to ask for.
For starters, users can set a yearly goal of pages and books read, in addition to audiobook minutes listened to. Some readers are visually impaired or even prefer listening to audiobooks, so this feature makes The StoryGraph more inclusive, which is essential because the book community is diverse and needs this accessibility to appeal to readers worldwide.
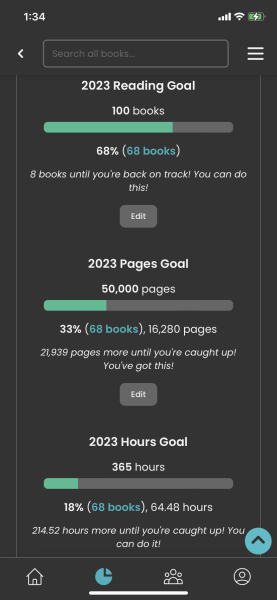
In addition to this, I was excited to learn that The StoryGraph kept track of my book statistics every year.
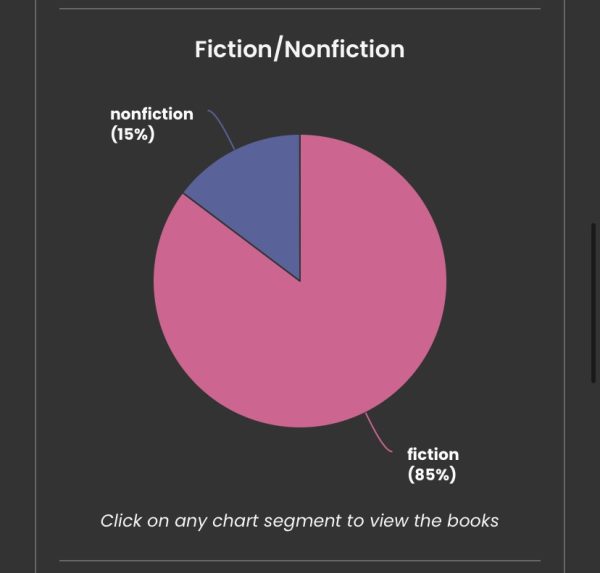
As someone who values diverse reading, I could now see how many genres I was reading, the authors I had read more than once, my fiction to nonfiction preferences, and which languages I was reading in.
Thanks to The StoryGraph, I have seen which genres I need to read more from, which has helped me grow as a reader.
Since joining the book community, I have enjoyed sharing all book-related content, so I made it a point to tell all my friends and peers about The StoryGraph app, including my classmates at my alma mater, Taft College.
“I adore that The StoryGraph shows me all my stats, because I love numbers so damn much and just being able to see all the genres and authors and pages is just so nice. It has also helped me get back into reading by setting a reading goal, which is something I’ve wanted to do since I stopped reading in high school,” said Suzanne Parker, psychology, sociology, and communications major at Taft College, and future California State University, Bakersfield Roadrunner.
Like myself, Parker slowly transitioned from using Goodreads to The StoryGraph. Although this might seem overwhelming to some, users can download their data to The StoryGraph. Given the thousands of books on my Goodreads account, if I had had to input all my information manually, I would have continued to use Goodreads instead of opting to start over.
Additionally, The Storygraph offers features that might entice readers to join who might still feel committed to Goodreads because of its familiarity.
In an article titled “The StoryGraph is better than Goodreads because it has more features,” author Brynn Schwartz said, “When a book is marked as ‘currently-reading,’ users have the
option to add notes about the book, which is where readers can mark epiphanies, quotes, tags, annotations or anything else they would like to add about the book privately.”
This is a helpful feature, given how many readers value sharing their thoughts and annotations, have. Furthermore, readers can create additional challenges, input different editions or books not currently available on The StoryGraph, and mark which books they own.
As book-related content becomes more popular over time, I hope that readers of all stages can discover The StoryGraph because it is truly a service that can benefit everyone.


